


VisualVM is an open source tool for monitoring and profiling your Java applications. VisualVM is now integrated with JDK 6 update 7 release and also available as a stand-alone setup. Java 7 plans to integrate next version 1.2.
So, from now on you need not pay a hefty price for licensing third party profilers. In this article we’ll walk through the features of VisualVM and see how it is different from commercial profiling tools.
Let’s see what the entire buzz is all about.
It provides a nice graphical user interface for monitoring and troubleshooting Java applications and integrates several troubleshooting features introduced in JDK 5 and 6 as command-line utilities into this single GUI tool.
I liked their screen-cast that shows VisualVM in action. It should help you get started:
VisualVM, Java’s own monitoring, profiling and performance benchmarking tool.
Even though many monitoring and diagnostics features are enhanced and introduced in Java 6, still it has been lacking an out-of-the-box bundling of a convincing visual Java application monitoring or profiling tool, until the most recent JDK6 Update 7.
You can find VisualVM under the bin directory of your JDK6u7 installation. Just double click the exe and its there the VisualVM.


The main window of VisualVM opens when you launch the application. By default, the Applications window is displayed in the left pane of the main window. The Applications window enables you to quickly see the Java applications running on local and remote JVMs. The Applications window is the primary entry point for viewing further details about a particular application. Right-clicking an application node opens the popup menu where you can choose to open the main application tab or take thread or heap dumps.


If you have used the Netbeans platform, you can easily recognize that VisualVM is also built upon the Netbeans Platform.
Now that you have VisualVM running you can do several things like
1) Create and visually view heap Dumps
2) Profile memory usage
3) Profile CPU Usage
4) Profile Threads
In the past you had to use one or more commercial tools to get the above tasks done. But with VisualVM you have one integrated tool that can do all the above.
VisualVM allows you to do much more than traditional monitoring and profiling.
1) You can take a snap shot of the thread status and heap status and save them for analyzing offline.
2) You can monitor multiple applications both local and remote from a single VisualVM instance. You can also take simultaneous thread dumps of multiple applications for analyzing distributed dead locks.
3) No need for complex configuration. Traditional memory profilers either require you to run your applications in a special, modified JVM or start your applications with the profiler agent. But with VisualVM, you start your java applications normally and VisualVM automatically lists the Java applications running on your local machine.
4) VisualVM is extensible. Yes we love plugins, and since VisualVM is built on the NetBeans Platform, its architecture is modular and easy to extend with plugins. There are several plugins already available for VisualVM like:- MBeans Browser, JConsole Plugins Container, VisualVM Extensions, Visual GC Plugin, GlassFish Plugin, BTrace Plugin, TDA Plugin.
VisualVM, the lightweight profiler and troubleshooting tool is available to build as part of IcedTea6 for 32 and 64 bit arch ![]()
`jvisualvm` is put in the ${JDK}/bin directory along with the rest of the tools.

Here are some VisualVM Screenshots:
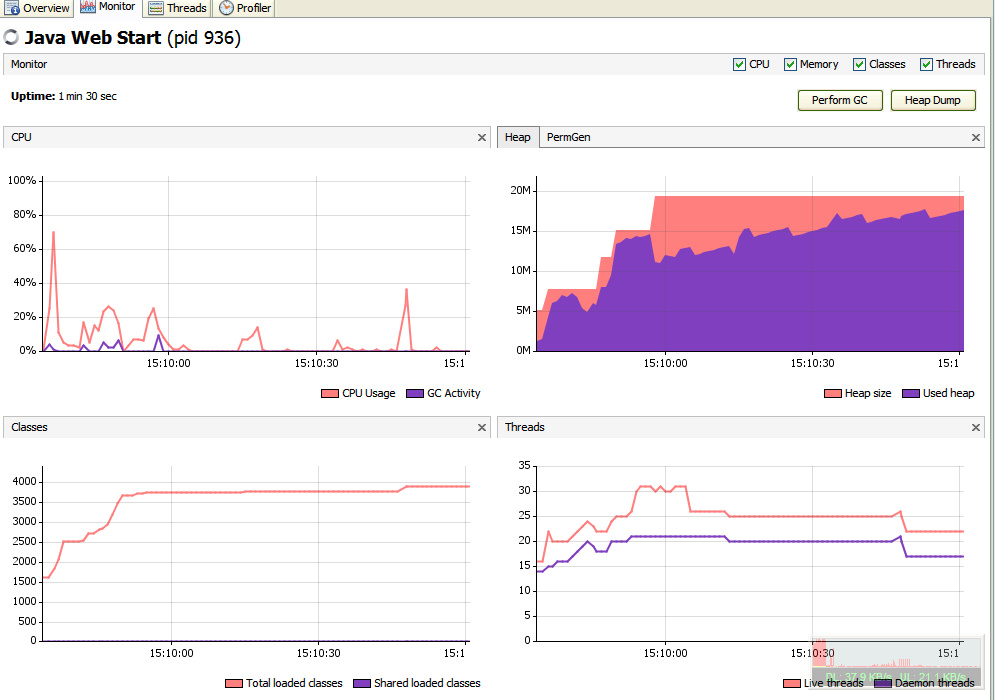
Screenshot1: Benchmark CPU usage and Heap memory usage during execution of a JavaFX web gallery.

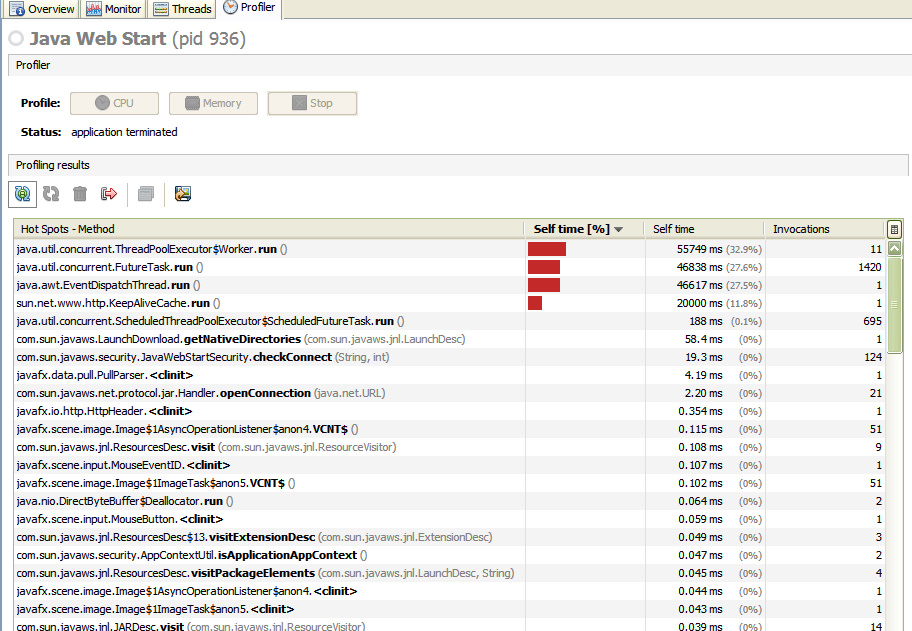
Screenshot 2: Method, class Execution Profiler

This tool has a lot of potential. A while back I used to benchmark JavaFX. And today, it’s my first choice for benchmarking any application. Finding memory leaks, performance bottlenecks, Heap usage optimizations, all can be done graphically, goodbye to other tools.
For many situations, this tool can prove out to be a great reverse-engineering tool at Runtime. For instance when you have a jar, war, ear running and it is misbehaving and there is no traces in the logs, visualVM can help. This tool will let you know what part of code was executed that caused peaks in CPU/memory usage, or potential memory hogs in your application.
Threads tab, like many other debuggers, will give you complete info on all the running threads: Time, state, id, etc.
See also the Java VisualVM User Guide:
http://java.sun.com/javase/6/docs/technotes/guides/visualvm/index.html
VisualVM project page:
https://visualvm.dev.java.net/gettingstarted.html
Do you know any Open source tool that can outperform VisualVM in speed and features? Let me Know.
Follow me on Twitter, Join Facebook Page or Subscribe to RSS for more Tech Updates.